
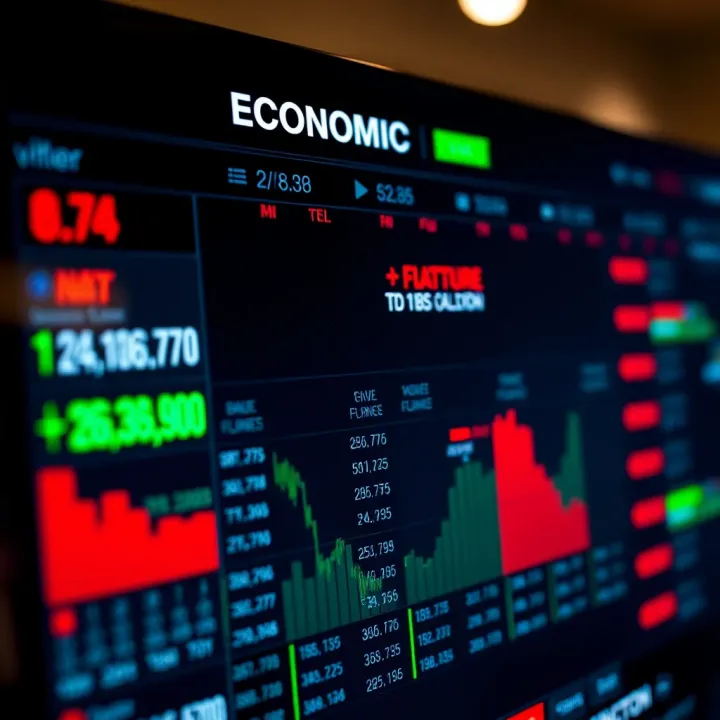
Calendario Económico en Investing para Inversionistas
📅 Descubre cómo usar el Calendario Económico de Investing para análisis financiero efectivo. Domina eventos clave e impulsa tus decisiones de inversión.
Por
Diego Torres
Editado por
Diego Torres
An economic calendar lists major economic events, data releases, and indicators scheduled throughout the year. For investors and traders, this tool is like a roadmap — signaling when market-moving news, such as inflation reports or job numbers, will hit. Knowing these dates helps you anticipate volatility and adjust your strategies accordingly.
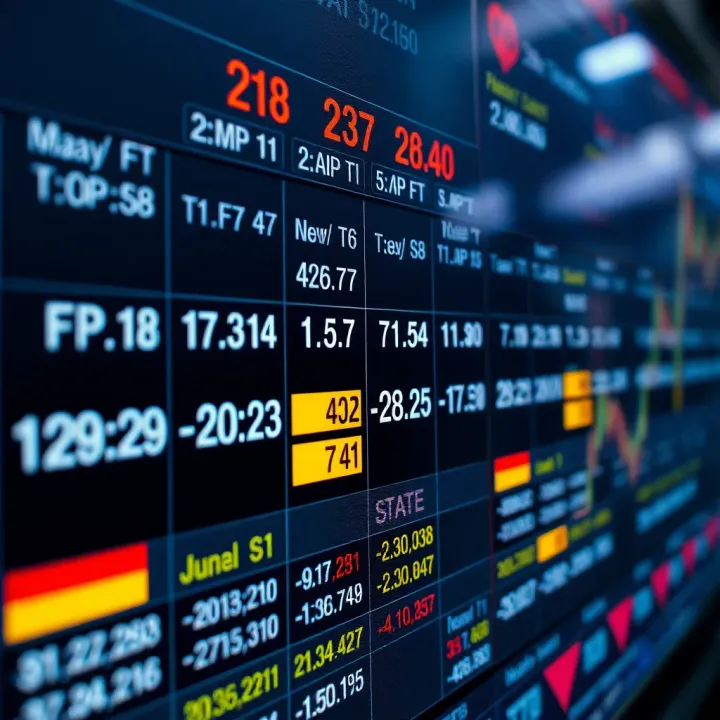
Dates and Times: Most calendars list exact release dates and times, usually in Eastern Time. Timing matters because market reactions often happen immediately.
Event Descriptions: Each entry explains what the data is (e.g., Consumer Price Index, GDP data, Federal Reserve announcements).
Forecasts and Previous Data: Many calendars show expected values alongside past results, letting you gauge whether upcoming numbers might beat, meet, or miss expectations.
Market Impact Rating: Some tools provide a scale indicating how much an event usually affects markets, helping you prioritize what to watch.
Understanding these elements lets you avoid surprises and grasp why markets move after certain announcements.
Imagine you’re about to invest in tech stocks. The economic calendar warns you that the Federal Reserve will announce interest rate decisions next week. Since rate changes can reshape investor sentiment dramatically, you might decide to wait or hedge your bets.
For traders focusing on currencies, the economic calendar is gold. Currency values often swing sharply around employment data or central bank statements, so being ahead of these events can mean the difference between profit and loss.
Nonfarm Payrolls: Reflects US job growth, influencing consumer spending.
Consumer Price Index (CPI): Indicates inflation trends.
Gross Domestic Product (GDP): Measures overall economic health.
Federal Reserve Meetings: Reveal policy changes impacting interest rates.
Check the calendar daily during earnings season or ahead of major events.
Focus on events with high market impact ratings.
Compare forecasts with prior data to set your expectations.
Using the economic calendar realistically means treating it as one part of your toolbox. It doesn’t guarantee market moves but gives you a heads-up so you aren’t caught off guard. By tracking scheduled events and understanding their significance, you gain an edge to plan trades and investments more confidently.
An economic calendar is a vital tool for investors and traders who want to keep a finger on the pulse of the financial markets. It lists scheduled economic events like reports, announcements, and data releases that can cause price swings in stocks, currencies, bonds, and commodities. Understanding this calendar means you can anticipate potential market movements and adjust your investments accordingly, reducing surprises and spotting opportunities.
An economic calendar is basically a timetable of upcoming economic events that have the potential to impact markets. These include things like GDP releases, unemployment figures, inflation reports, central bank meetings, and manufacturing data. Investors use the calendar as a reference to know when important information will hit the market and to prepare for possible price volatility. For example, traders might watch the December jobs report closely because it can set the tone for Federal Reserve policy decisions.
Most economic calendars are presented as easy-to-read tables or lists, organized by date and time. Key details usually include the event name, the releasing body (like the Bureau of Labor Statistics or Federal Reserve), the actual number versus previous numbers, and market expectations. Popular financial news websites like Bloomberg, CNBC, and Investing.com offer such calendars, while brokerage platforms like TD Ameritrade provide integrated tools allowing users to set alerts for events relevant to their portfolio.
Markets react strongly to economic data because they provide insights into the health of the economy and corporate profitability. For instance, a higher-than-expected inflation reading can unsettle bonds and stocks as investors anticipate faster rate hikes. This sensitivity means traders need to pay attention to data releases, since even a slight surprise can lead to sharp price changes. Remember the 2021 CPI report? When inflation proved higher, it triggered swift reactions across sectors.
Economic reports can influence markets in different ways over time. In the short term, unexpected data may cause quick, volatile price moves. Day traders thrive on this. But over the long haul, trends in economic indicators help guide bigger investment decisions—like shifting from growth stocks to value stocks if data shows a slowing economy. Understanding which reports influence short-term swings versus long-term trends helps investors tailor their strategies effectively.
Knowing when key economic events occur and understanding their likely impact turns the economic calendar from just a list into a strategic advantage for savvy investors.
Understanding key economic indicators is essential for any investor aiming to make informed decisions. These indicators shed light on the broader economic environment and often influence stock prices, bond yields, and currency values. Keeping an eye on them helps you anticipate market trends and adjust your portfolio accordingly.
GDP measures the total value of goods and services produced over a specific period and serves as a primary gauge of economic activity. When GDP figures come out stronger than expected, markets often react positively because it signals robust economic health, buoying corporate profits. For example, in Q1 2023, the U.S. GDP grew at a brisk 3.5%, prompting a rally in sectors tied to consumer spending and industrial production.
Assessing GDP growth over time paints a clearer picture of the economy’s health than a single report. A steady uptick in GDP suggests sustained expansion, which is typically good news for equities. On the flip side, a shrinking GDP for two consecutive quarters signals a recession, warning investors to be more cautious. Watching these trends helps investors decide whether to tilt toward growth stocks or more defensive assets like bonds.
Employment reports are closely watched because job growth fuels consumer spending, which drives corporate revenues. A higher employment rate usually indicates increased consumer confidence and spending power, benefiting sectors like retail and services. For example, after positive monthly jobs data in late 2023, retail stocks saw notable gains due to expectations of stronger holiday sales.
Interpreting monthly job reports involves looking beyond headline unemployment rates. It’s important to examine details like labor force participation, wage growth, and temporary layoffs. An unemployment rate dropping because people stop looking for jobs isn't a good sign. Similarly, wage growth signals inflation pressure, affecting consumer purchasing power and potentially prompting central banks to adjust interest rates.
Inflation reports, particularly the CPI, reveal how much prices for everyday goods and services are rising. Elevated inflation erodes purchasing power, making it harder for consumers to spend freely. This compels central banks, like the Federal Reserve, to raise interest rates to cool down the economy. Higher rates can lead to lower stock valuations, especially for companies reliant on cheap borrowing.
Tracking inflation trends helps investors adjust their portfolios. For instance, when inflation spikes, sectors such as energy and commodities often benefit, while bond prices tend to fall. Additionally, persistent inflation can hurt long-term growth stocks but may create opportunities in value stocks or Treasury Inflation-Protected Securities (TIPS). Recognizing these shifts enables smarter allocation of assets to guard against inflation’s bite.
Staying on top of these economic indicators lets investors make smarter, timely moves rather than reacting after the fact. Remember, the calendar highlights when important data drops, but it’s the interpretation and context that truly drive decisions.
Economic events on the calendar offer critical clues about market direction and investor sentiment. Understanding these events helps investors spot opportunities and risks tied to shifts in the economy. Different categories from central bank announcements to consumer surveys provide distinct insights and potential market moves.
Central banks, notably the Federal Reserve in the U.S., set interest rate policies that shape borrowing costs and influence economic activity. When the Fed or other major global banks like the European Central Bank and Bank of Japan announce interest rate targets or monetary policy changes, markets respond immediately. For example, a surprise rate hike by the Fed can cool off tech stocks and boost the U.S. dollar.
Market reactions to these announcements often bring increased volatility, as traders and investors adjust positions based on the new outlook. Volatility spike around rate decisions is not just noise; it reflects real shifts in expected growth and inflation. Savvy investors watch the tone of central bank statements closely, since subtle changes in language can signal future moves well before official decisions.
Trade balance numbers and manufacturing indices reveal the economic momentum behind the scenes. For instance, a rising trade deficit could hint at weakening domestic production or stronger consumer demand for imports. Meanwhile, manufacturing reports like the ISM Manufacturing Index track factory activity and can indicate expansion or contraction phases.
This data is especially relevant for sector-specific investments. Commodities, for example, often respond to manufacturing strength; metals prices may climb if factories ramp up production. Likewise, trade reports influence sectors tied to imports and exports, such as technology hardware or agriculture, giving investors clues on which industries might outperform.
Sentiment surveys measure how confident consumers and businesses feel about current and future economic conditions. These surveys often drive market expectations and can either reinforce or challenge hard data. For example, even if employment figures look solid, a drop in consumer sentiment might suggest spending could slow.
Key sentiment indices include the University of Michigan Consumer Sentiment Index and the Conference Board’s Consumer Confidence Index. For businesses, the National Federation of Independent Business (NFIB) survey offers a look at small business optimism. These surveys provide actionable insight by reflecting the mood behind spending and investment decisions, helping investors anticipate shifts in market behavior.
Following these economic events closely can give investors a leg up in predicting market trends and managing risk effectively.
An economic calendar isn’t just a list of dates; it’s a tool that can shape how you approach investing. Knowing when key economic events happen helps you plan trades better and manage risks effectively. Investors who weave economic data into their strategy tend to avoid surprises and spot chances before the broader market reacts.
Economic reports often trigger sharp swings in markets. For instance, a less-than-expected jobs report from the Bureau of Labor Statistics can send stocks tumbling or boost bonds instantly. By checking the calendar ahead of these releases, you can avoid getting caught on the wrong side of a sudden move. This might mean waiting until after the data drops to enter a trade or temporarily reducing exposure in sensitive sectors.
Sometimes, the market moves in anticipation of upcoming events. If you spot a trend where inflation data consistently raises concerns, you might position yourself beforehand — say, by buying inflation-protected securities or sectors that benefit from rising prices. Traders often use economic calendars to align with these predictable patterns, turning scheduled releases into windows for potential gains.
When a major report like the Federal Reserve’s interest rate decision is due, it’s smart to reassess your positions. Scaling back on high-volatility stocks or reducing leverage can protect your portfolio if the market reacts negatively. For example, ahead of a Fed announcement, some investors reduce exposure to financials and cyclical stocks that tend to swing sharply.
Protecting trades around economic events involves using stop-loss orders to limit potential losses. You might also hedge positions using options or inverse ETFs. For instance, if you own a tech stock sensitive to economic growth signals, buying put options or shifting some capital into gold ETFs can offset losses if the data disappoints.
Economic indicators give you the "what" behind market moves, but technical analysis reveals the "when" and "where." Blending both approaches improves decision-making. If consumer confidence rises (fundamental data) and the stock’s chart shows a breakout pattern (technical signal), the combined insight strengthens the trade case.
While economic data is important, it’s not the whole story. Markets may react unexpectedly or already price in outcomes before announcements. Relying solely on calendar events can lead to missed opportunities or unnecessary trades. It’s vital to consider overall market context, company fundamentals, and broader trends to avoid getting blindsided.
The bottom line is using the economic calendar as a guide—not a crystal ball. It helps anticipate turning points but pairing it with solid analysis and risk management makes your investment strategy smarter and more resilient.
Grasping the best ways to follow the economic calendar makes a big difference for investors and traders. Knowing where to find accurate info and how to handle it allows you to spot opportunities while avoiding noise. There’s a lot of data out there, but the key lies in smartly choosing what to watch and how to get alerts.
Financial news platforms like Bloomberg, CNBC, and Reuters offer real-time economic calendars that are updated frequently. These sources provide detailed forecasts, previous data, and explanations about the significance of each economic event. For example, if the U.S. unemployment rate is about to be released, these platforms won't just list the date—they’ll show expected figures and market reactions, helping you prepare your trades.
Brokerage platforms such as Charles Schwab, TD Ameritrade, or E*TRADE integrate economic calendars directly into their trading tools. This tight integration means you can plan trades right from your dashboard. Official government releases like those from the Bureau of Labor Statistics or the Federal Reserve provide authoritative, primary data. They’re the gold standard since they deliver unfiltered reports. Combining these official sources with brokerage insights creates a reliable setup for staying ahead.
Filtering by region, sector, and event importance can save you from getting overwhelmed. If you mostly trade tech stocks, focusing on U.S. manufacturing data or European consumer spending reports might clutter your view unnecessarily. Custom filters let you zero in on events that actually affect your specific investments, like housing starts for real estate or inflation data for commodities traders. This targeted approach helps you use your time smarter.
Setting alerts and reminders ensures you don’t miss critical moments. Many calendar tools allow you to set push notifications before major events, giving you time to adjust positions or prepare analysis. For example, a push alert an hour before the Federal Reserve’s interest rate decision lets you decide if you should tighten stop-loss orders or reduce exposure. This kind of customization keeps you proactive rather than reactive.
Prioritizing key events means focusing on those with the biggest market impact. Weekly job reports, central bank announcements, and inflation data typically have greater effects than minor trade statistics. Tracking only these helps prevent decision paralysis and enables quicker, clearer calls. It’s about cutting through the clutter to what really moves markets.
Balancing data with the overall market context keeps you grounded. Economic numbers don’t exist in a vacuum—for instance, a strong jobs report in a recession year might not boost stocks the way it would in a growth phase. Combining calendar alerts with your broader market knowledge or technical signals provides a fuller picture and prevents overreacting to isolated figures.
Mastering these best practices transforms your economic calendar from just a list of dates into a powerful tool supporting smarter investments and controlled risks.
By choosing trustworthy sources, tailoring the calendar to your focus, and honing your attention on impactful data, you’ll be able to navigate market swings with more confidence and clarity.
📅 Descubre cómo usar el Calendario Económico de Investing para análisis financiero efectivo. Domina eventos clave e impulsa tus decisiones de inversión.
📈 Descubre cómo usar el análisis técnico en Investing para interpretar gráficos, entender patrones y mejorar tus decisiones financieras con estrategias claras.

⚖️ Descubre cómo gestionar riesgos en tu organización con estrategias claras, procesos efectivos y ejemplos aplicados en contextos colombianos y empresariales.
📈 Descubre estrategias prácticas de swing trading adaptadas al mercado colombiano para maximizar tus ganancias en corto y mediano plazo con consejos claros y ejemplos.
Basado en 15 reseñas